Understanding the plots
The Weight History and Projection Plot
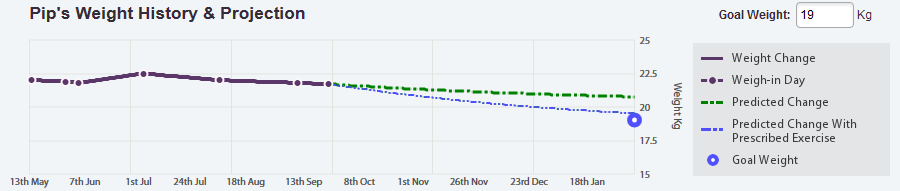
The weight history and projection plot is a simple line graph showing your patients weight change over time.
The HeyrexVet system uses this weight history combined with activity and diet data to make some predictions about how your patients weight will change over time and this is also displayed in this graph.
- Each recorded weight is indicated by a purple circle on the weight change line.
- The goal weight is indicated by a blue circle.
- When the exercise plan is enabled this graph will include two different predictions.
- Predicted change based on historical activity levels. (Green line)
- Predicted change based on prescribed exercise levels. (Blue line)