Understanding the Plots
Cage Rest Data
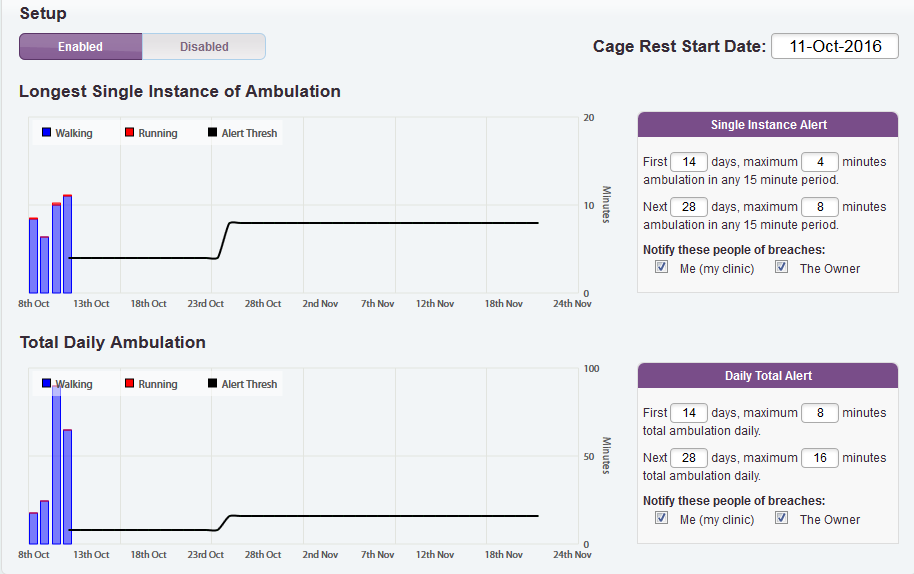
The cage rest module uses the daily activity data and acceptable levels set by you to determine whether your patient has been too active. This data is displayed in two separate graphs:
- Longest Single instance of activity
- Total Daily activity
When first enabled these bar graphs will show the three days prior to the stated start date and a line showing the specified thresholds.