Understanding the plots
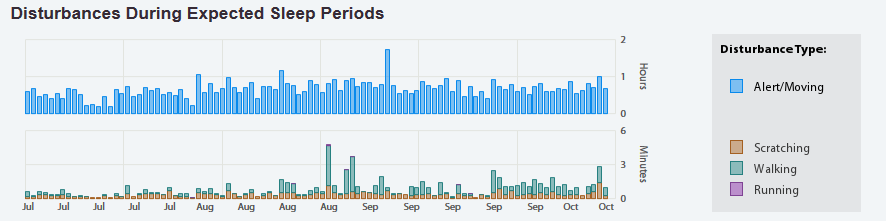
Disturbances During Expected Sleep Periods
Disturbances identified during expected sleep periods for your patient are displayed in 2 bar charts.
- Time spent alert/moving
- The scale on this graph is in hours
- Time spent walking, running and scratching.
- The scale on this graph is in minutes
Because the time spent alert/moving is often much greater than any other disturbance if they were displayed on the same graph you would not be able to see the other disturbances easily.
- Time spent alert moving each night time period is coloured light blue
- Time spent scratching each night time period is coloured orange
- Time spent walking each night time period is coloured green
- Time spent running each night time period is coloured pink.
Hovering your mouse over any of the bars will tell you the date and the exact values for the disturbances.
You can navigate backwards and forwards through the days by using the buttons above the total sleep graph.