Understanding the plots
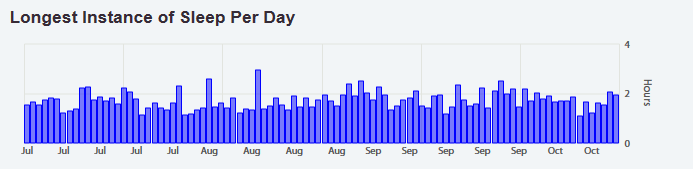
Longest Instance of Sleep and number of sleep/wake transitions
The longest instance of sleep per day is displayed in a bar graph.
Hovering your mouse over each bar will identify the date and the value for that day.
The number of times your patient wakes and goes back to sleep each day is also displayed in a simple bar graph.
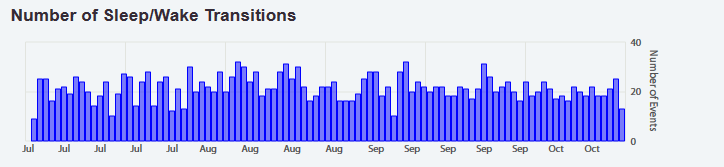
These graphs are a good indication of the quality of your patients sleep.
You can navigate backwards and forwards through the days by using the buttons above the total sleep graph.