Understanding the plots
Sleep Time of Day Map
The sleep time of day graph is a 'heat map' showing your patients sleeping patterns and how they are changing. (Don't panic, it's not as scary as it looks)
- Each bar on the x-axis represents a single day.
- Each square on the y-axis represents a 15 minute period in that day.
- The colour of each 15 minute square indicates the amount of time during that period your patient was asleep.
- A white square indicates your patient had no sleep in that 15 minute period
- A dark blue square indicates your patient was asleep for the whole 15 minute period.
- You can hover your mouse over each individual square for more detailed information.
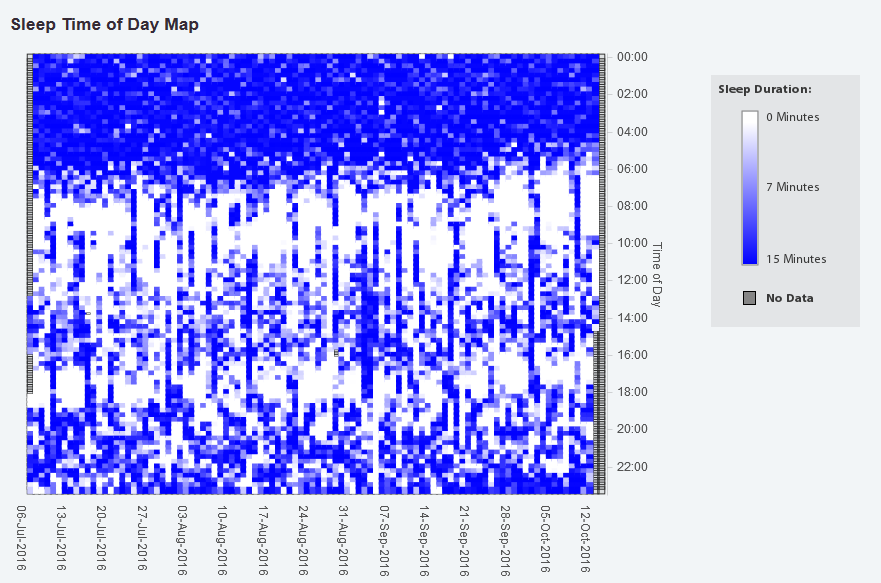
This graph is a very easy way of identifying quickly both sudden and gradual changes in your patients sleeping patterns.
You can navigate backwards and forwards through the days using the buttons above the total sleep graph.