Understanding the Plots
Longest Single Instance Plot
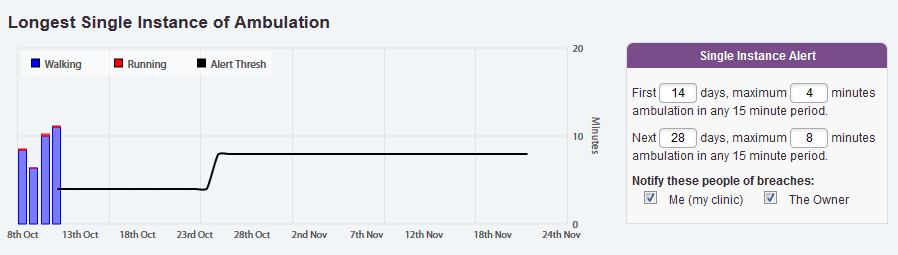
The longest single instance plot is a simple bar graph showing the 15 minute period of each day that contained the highest levels of walking and running.
- Walking is shown in blue
- Running is shown in red
- Acceptable threshold levels are indicated by a black line across the plot.