Understanding the Plots
Total Daily Acitvity Plot
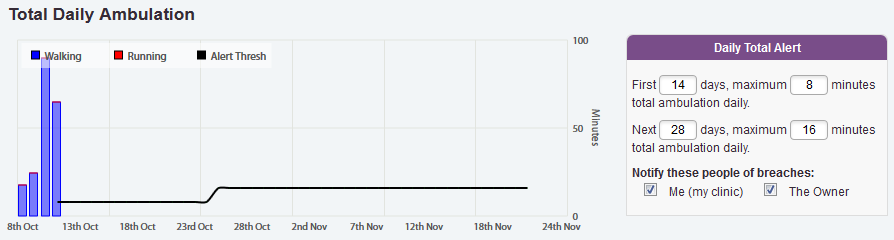
The Total Daily Activity plot is a simple bar graph showing the total level of walking
and running for each day.
- Walking is shown in blue
- Running is shown in red
- Acceptable threshold levels are indicated by a black line across the plot.