Heyrex App Plots
Daily Activity
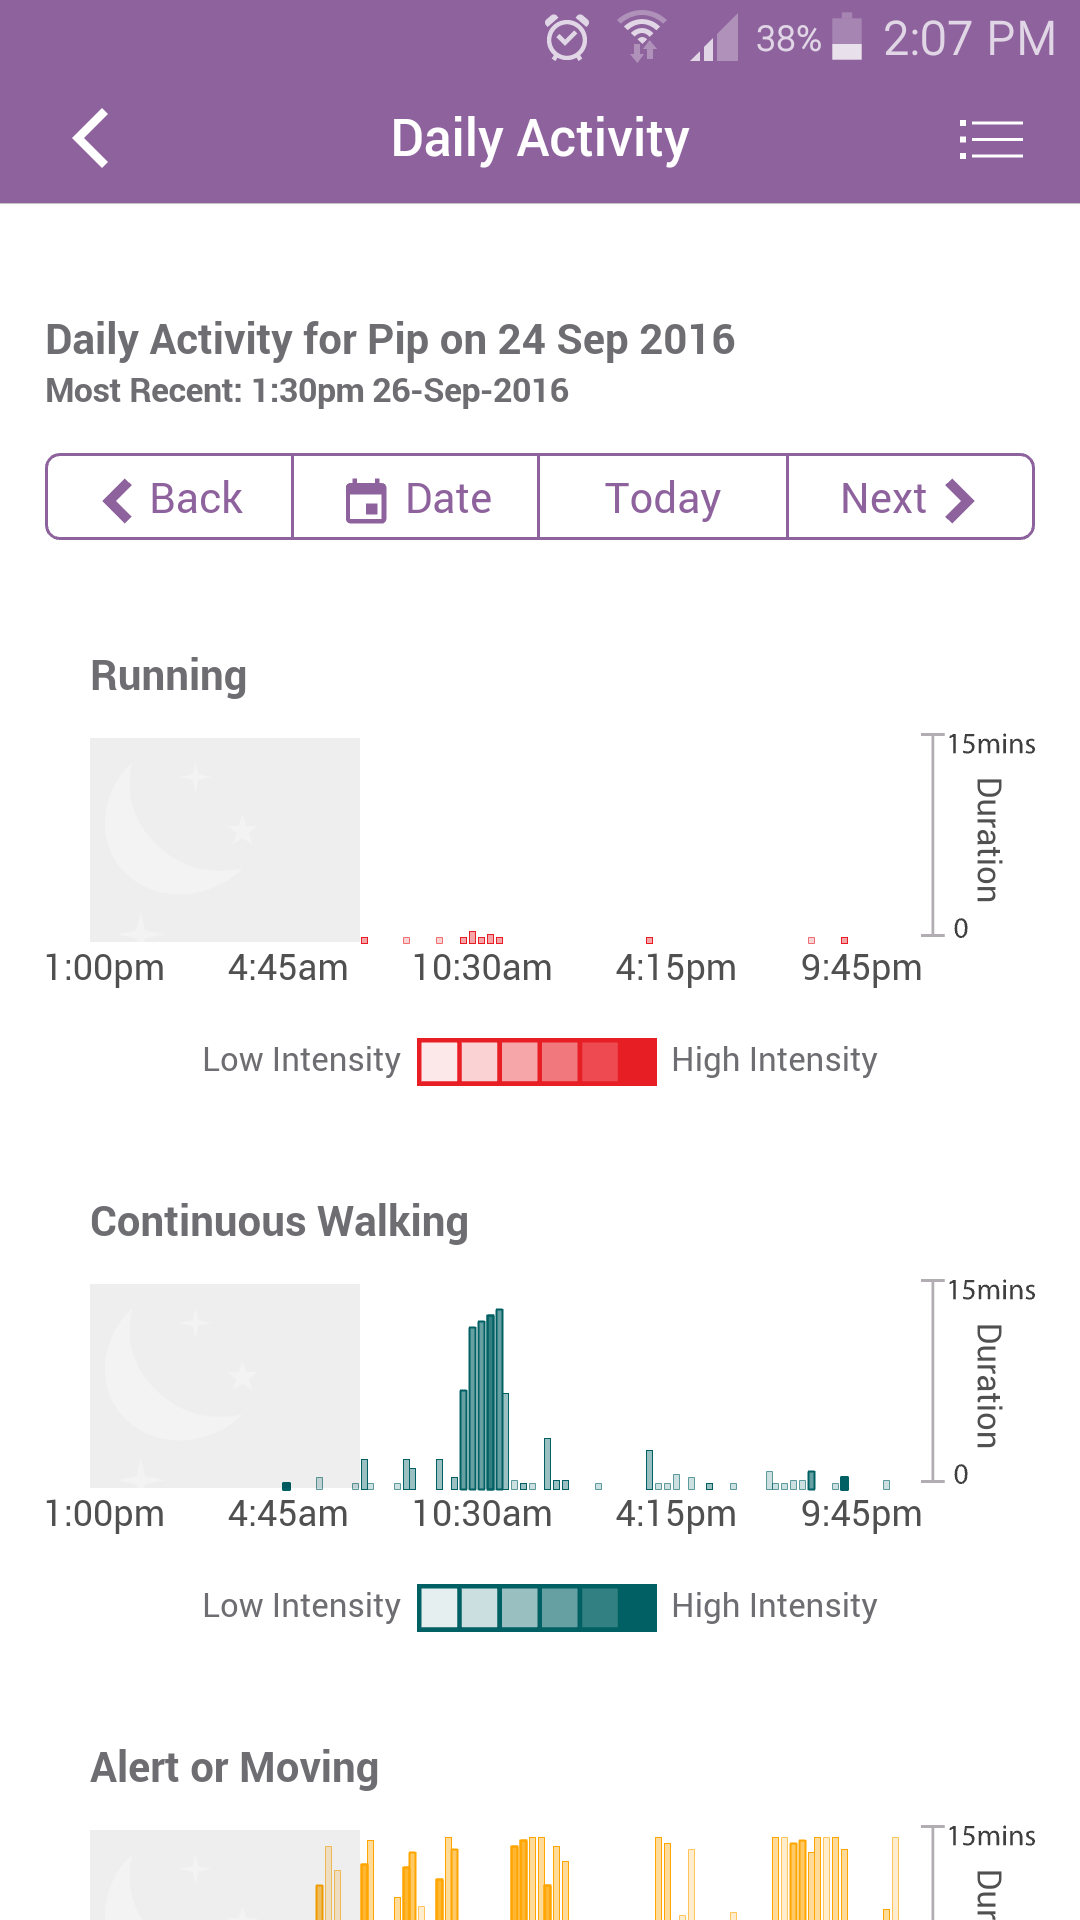
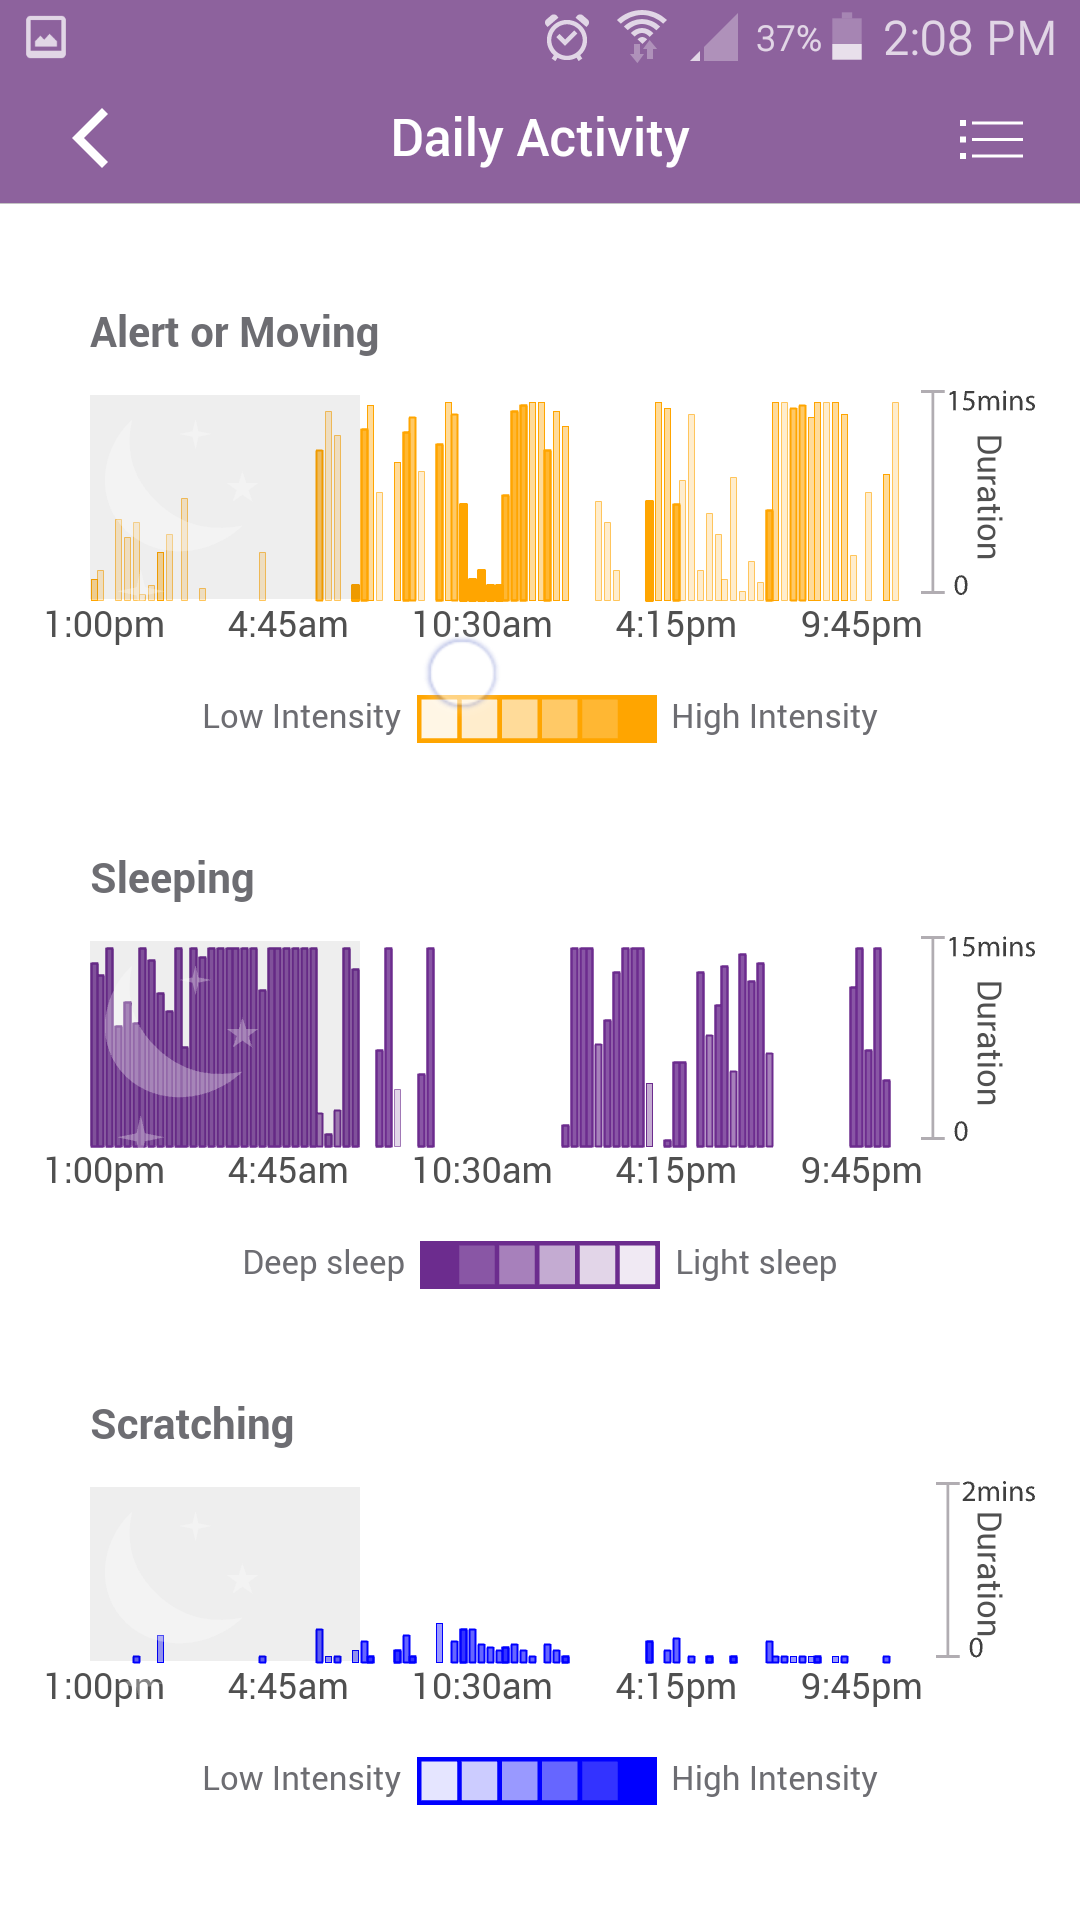
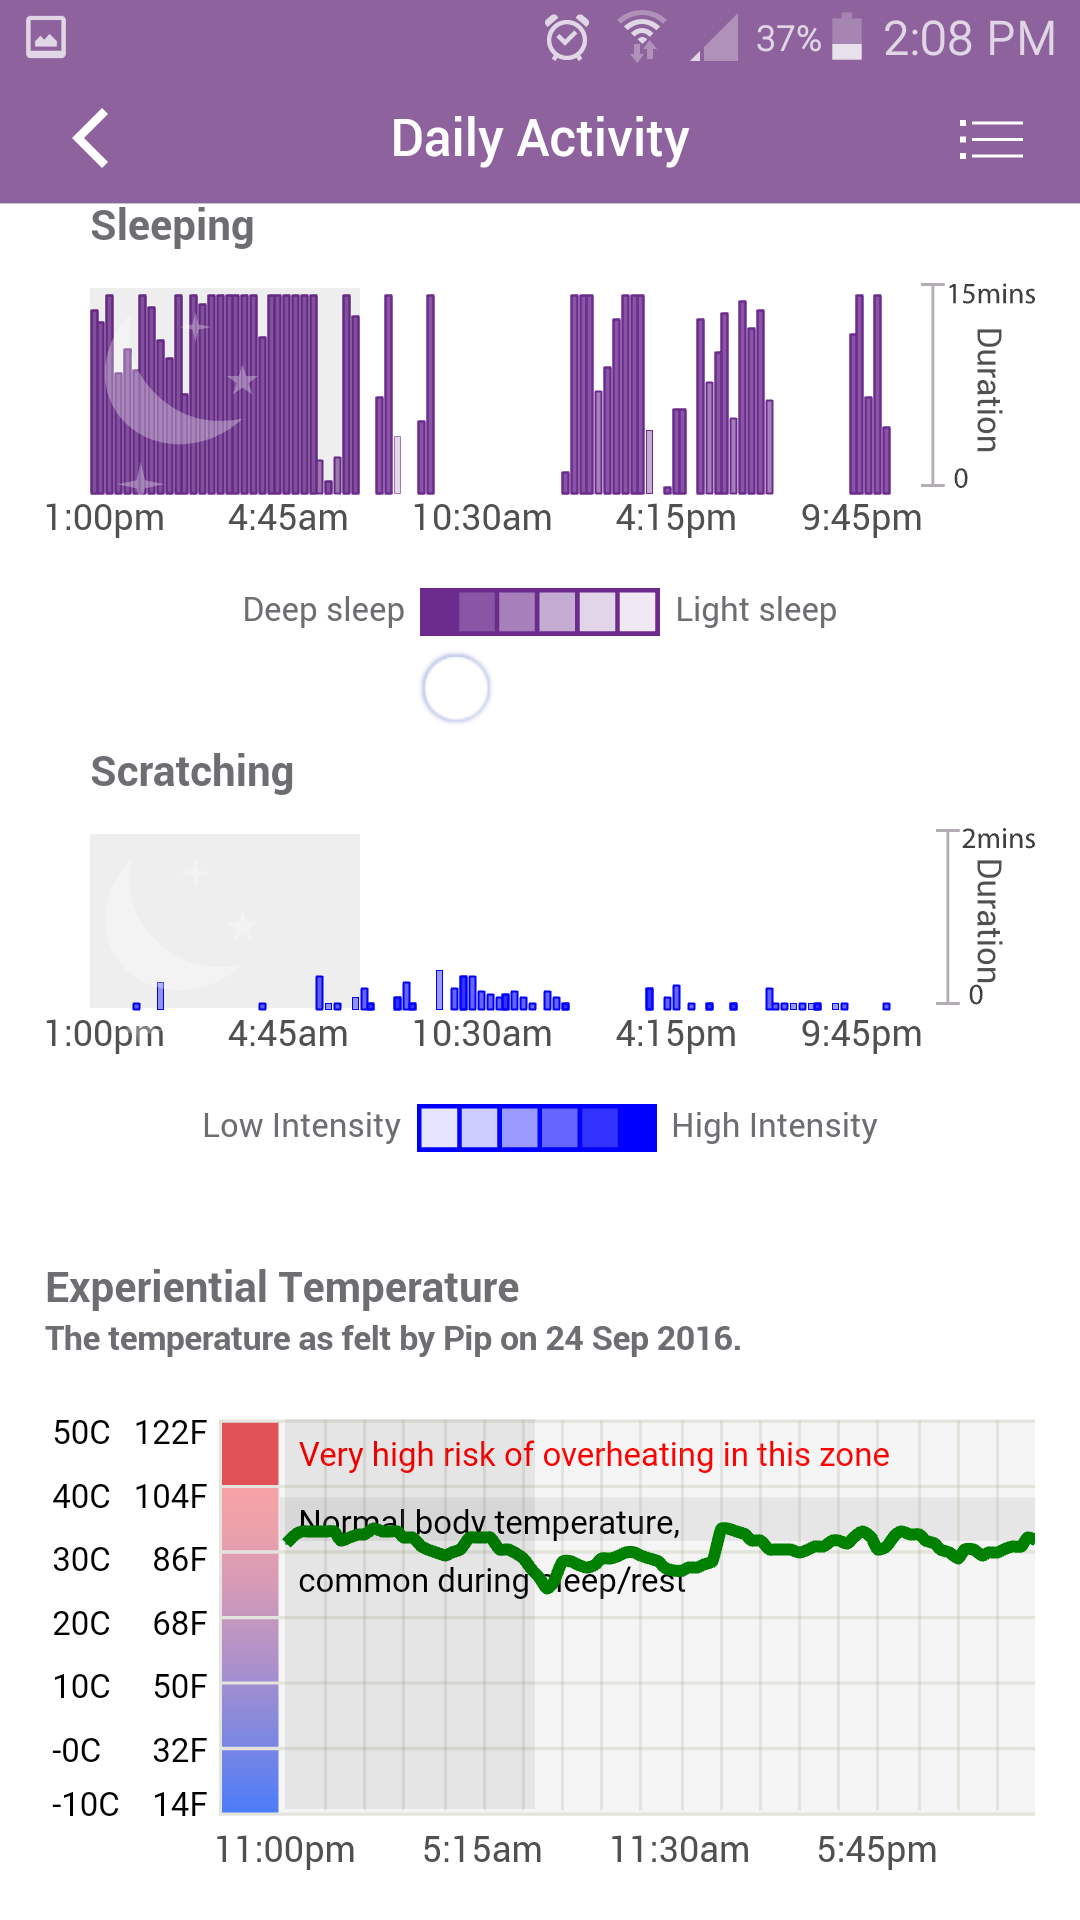
This screen contains a variation on the daily activity graph and the experiential temperature
graph. In this format the daily activity is displayed on a number of bar graphs that show when the different behaviours occurred during the day in question.